Power BI-Clustered Column Chart
------->Click on the Clustered Column Chart in the visualization area.


Step:-1
------>Drag the order_date to the X-axis, After dragging it will show year,month,quarter, and day also.
------->If the date column is there in the table after dragging power internally extract year-wise, month-wise, quarter-wise, and day-wise.
-------> Most clients always will ask yearly, quarterly, and monthly.

Step:-2
------->Drag the sum of the sales column to the Y-axis after dragging the visual like below.

Step:-3
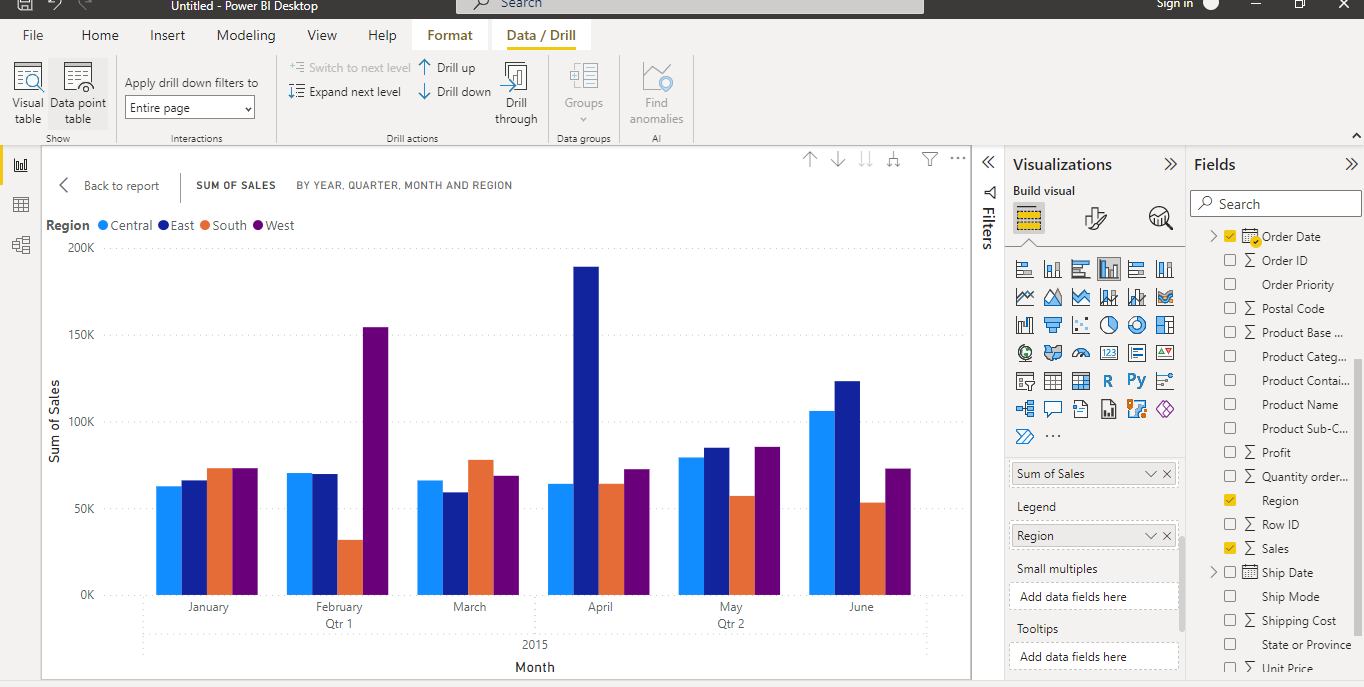
------->Legend means label it will thereafter Y-axis like below.

------->If we want region-wise sales then we can drag the region column into the Legend.
------->Then the visual like below.

------->Legend is like a group by operations.
Realtime:-
------->If you have 4 products there If you want to see the sales of every specific product wise
with the help of legend we can get it like region in the visual.
-------->For example we remove the legend let's see what will be happening in the below visual.

------>Can we absorb the above visual nothing information we are getting, there is no use?
------>With the help of Legend, we can get information.
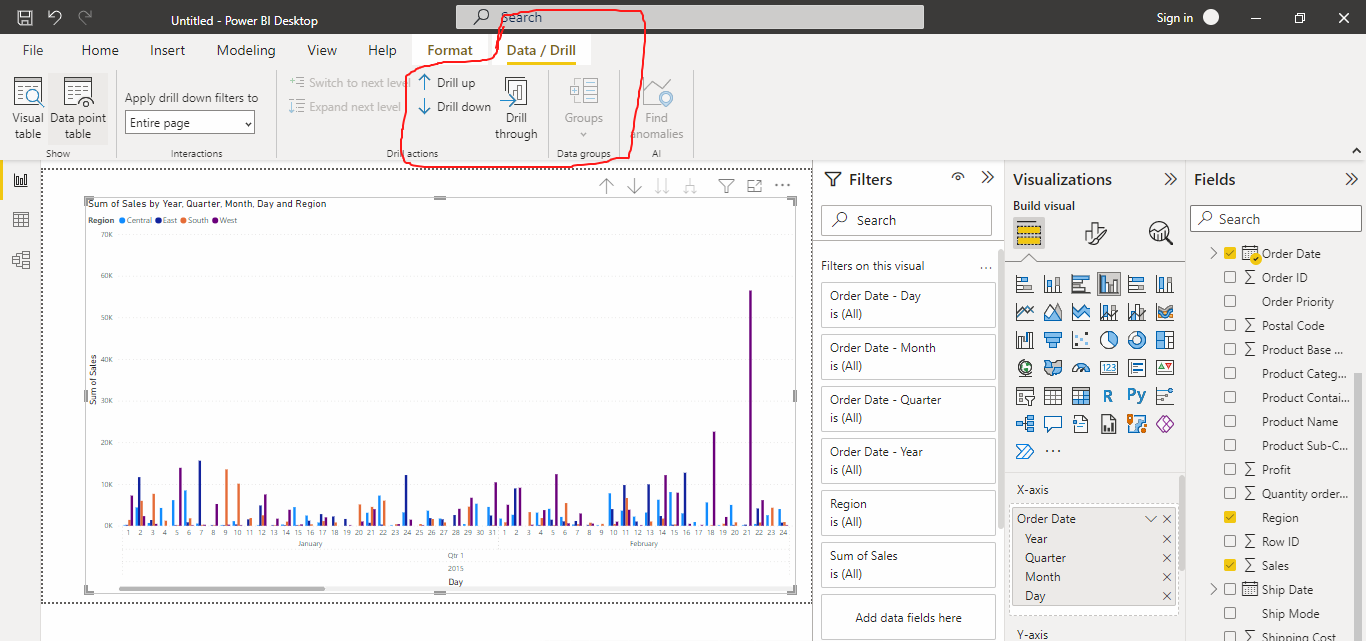
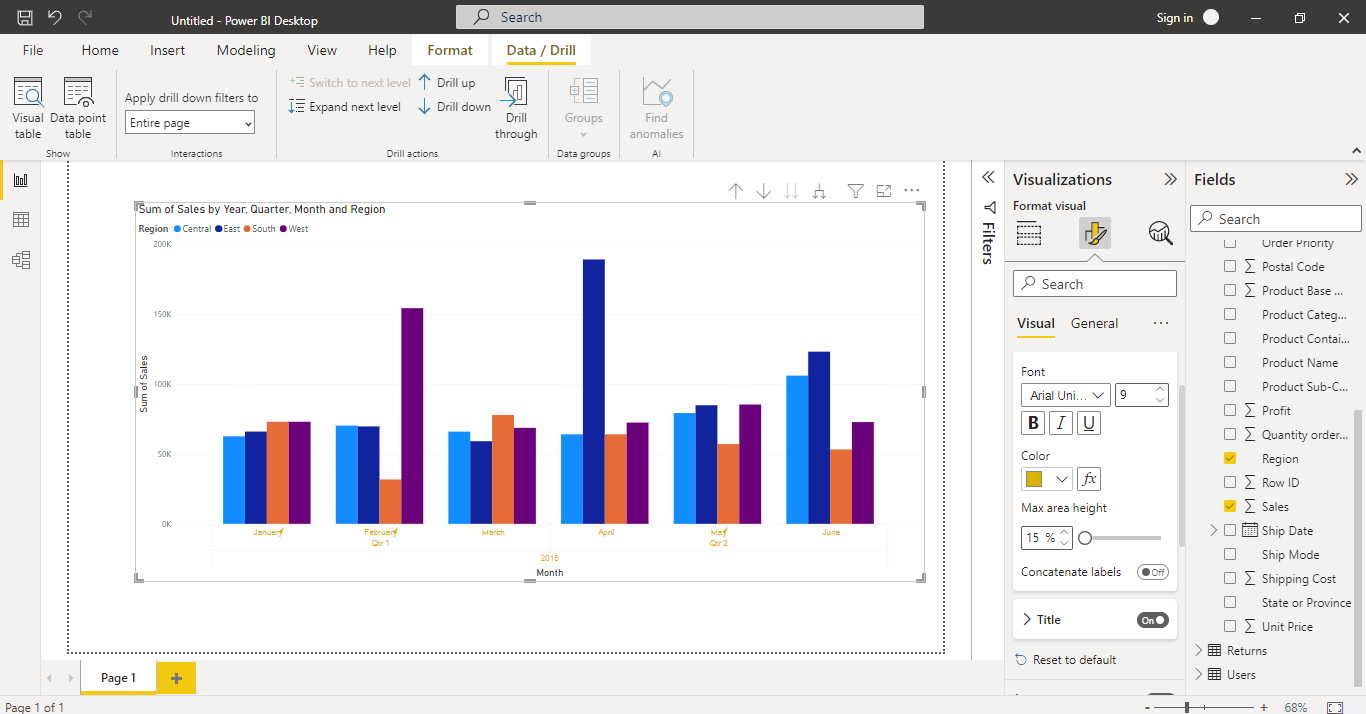
Step:-4
------->The very important option is data/drill.
------>It data/drill option after selecting the visual.
------>After selecting the visual the image below.

------>In case we do not select the visual it will not show the data/drill. an option like below.

----->Click on data/drill there are two options here.
1)Drill Up
2)Drill Down
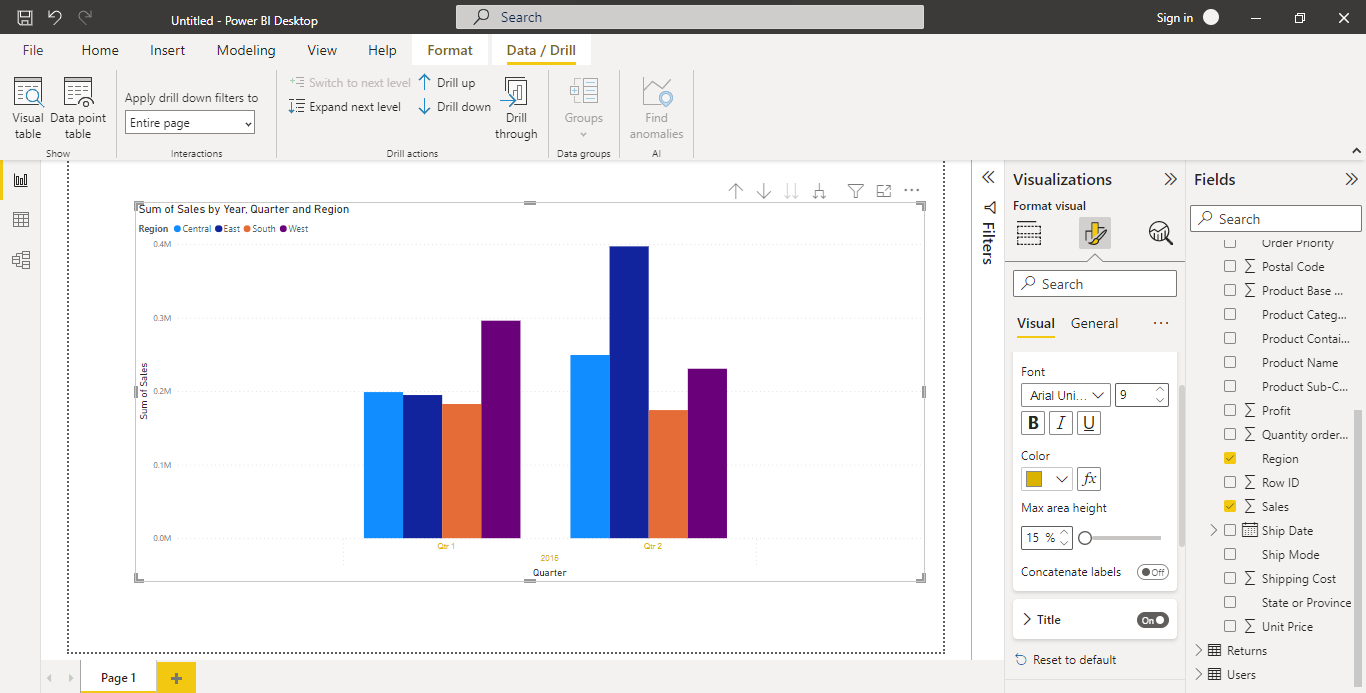
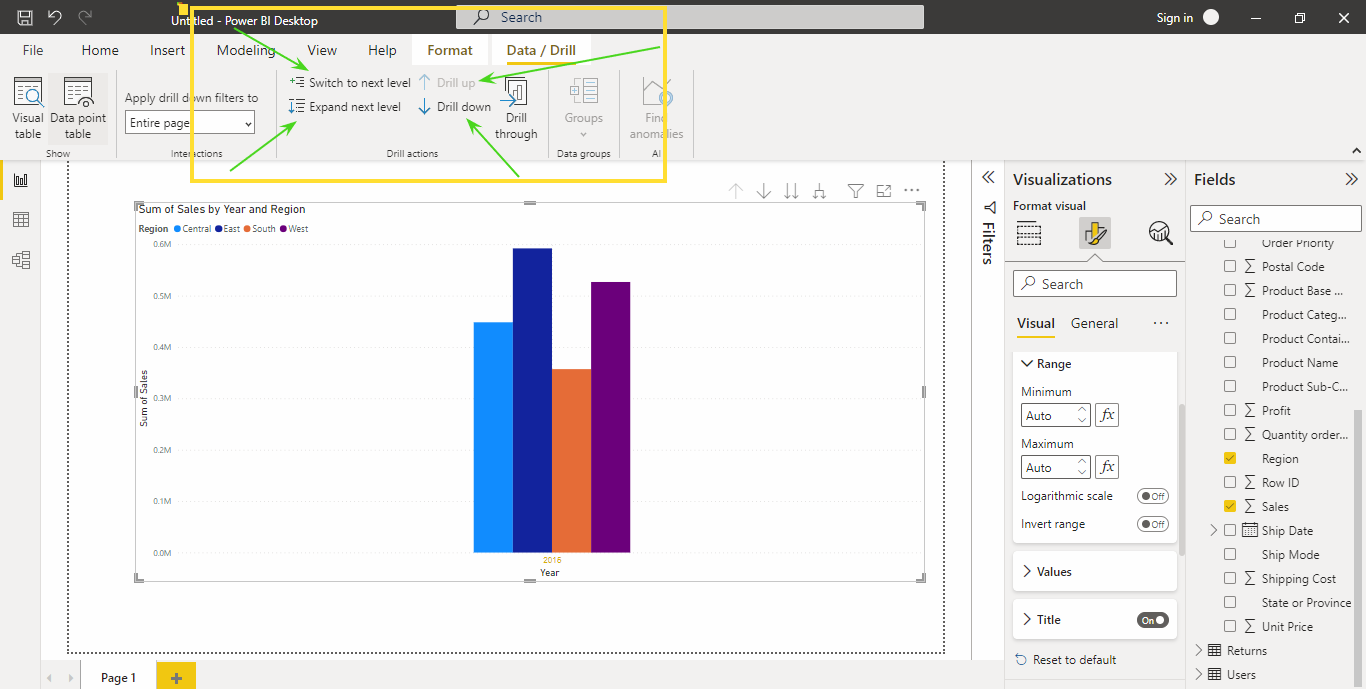
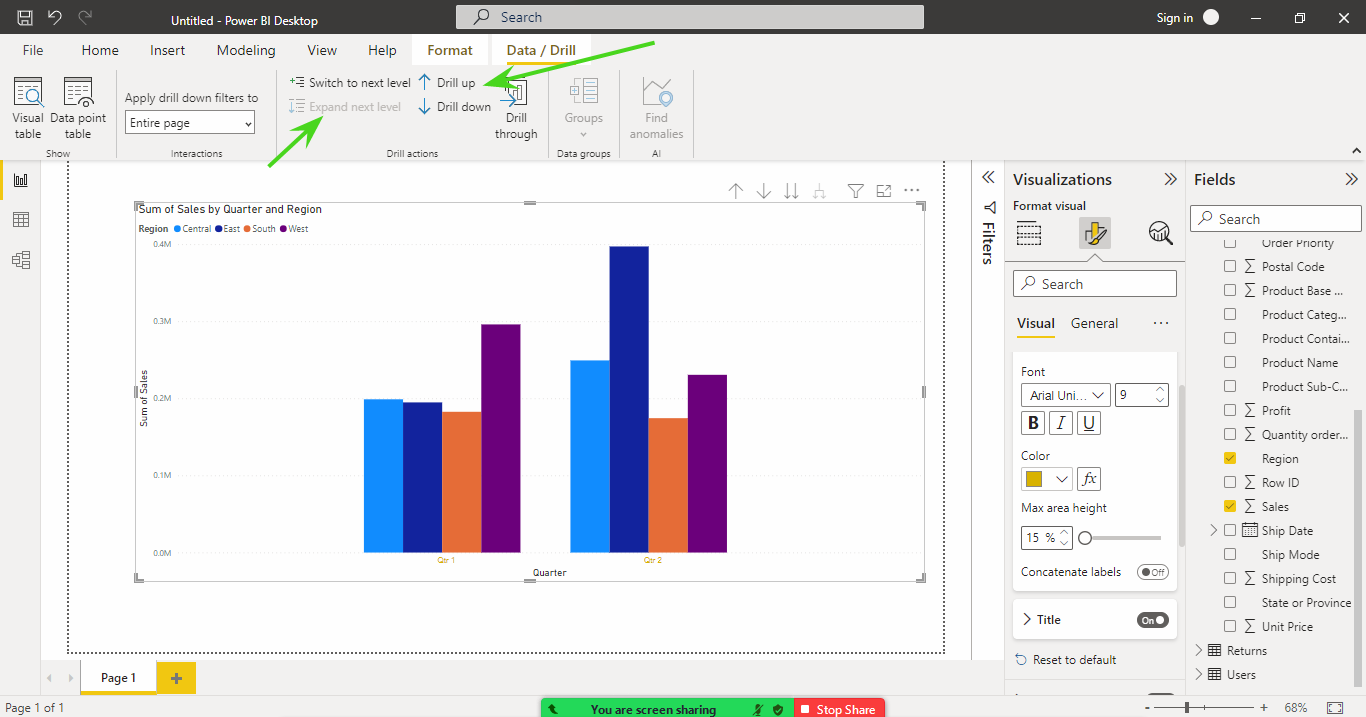
------>If you click on Drill Up days are gone like below.
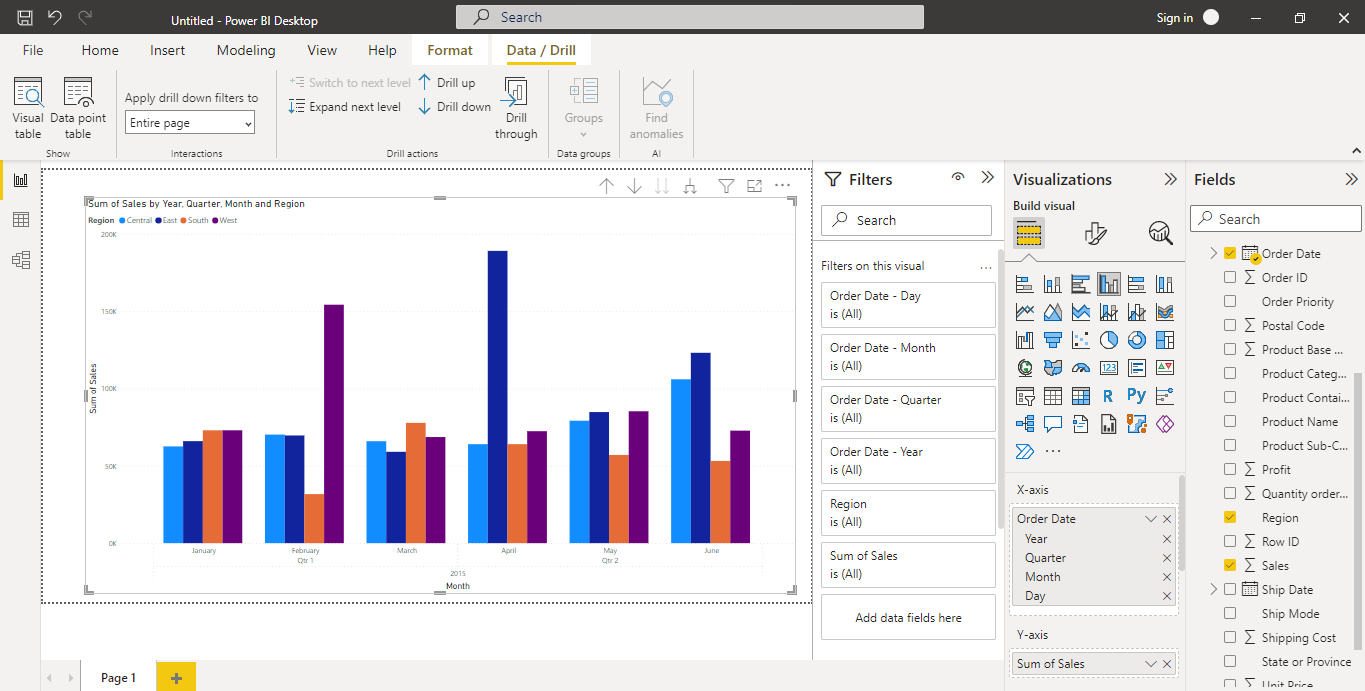
------>If you Drill Up, again and again, Month, Quater and Yearly wise visuals will be extracted.


R & D ON DATA/DRILL OPTIONS
1)This is original visual( we are not applied any drill up/drill option,Expand Next Level,Switch Next level)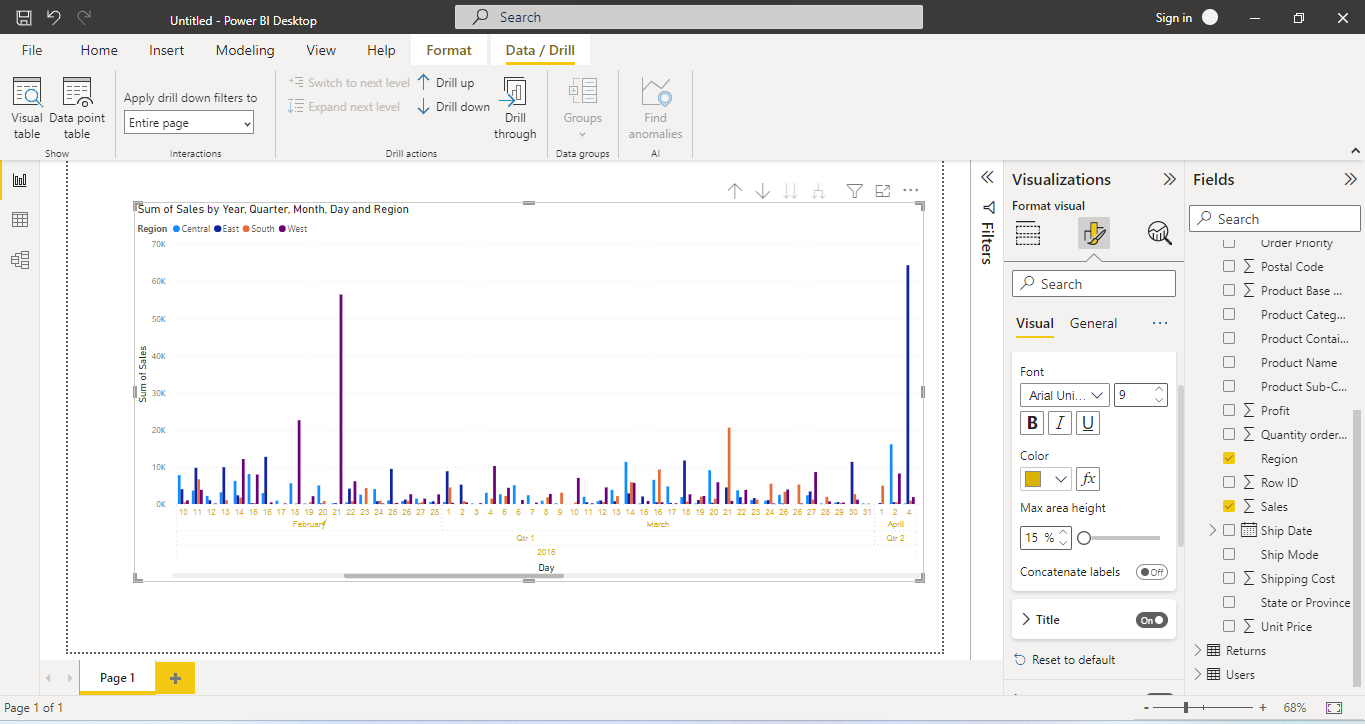


------>If the client wants to see your visual much wider use Focus mode.
2)IF I click the one-time drill-up option the visual is like the below. (days are not showing here)
3)IF I click one more time drill option the visual is like the below. (months are not showing here).
4)IF I click again one more time drill the option in the visual like below. (Quaters1,2 are not showing here).
Now R & D on Expand next level
------->Expand the horizontal axis to show the current level and the next level
in the hierarchy at the same time. (It shows the current level and next level of the X-axis)
1)If I click on Expand next level,The Visual is like the below.
2)If I click one more time on Expand next level, The Visual is like the below.
3)If I click again more time on Expand next level, The Visual is like below.
R &D On Switch to Next Level
------>Switch the horizontal axis to show the next level in the hierarchy.
1)The Orginal Visual like below.
2)If I click on the Switch to the next level, The Visual like below
3)If I click again one more time on Switch to the next level, The Visual is like below.
4)If I click again one more time on the Switch to the next level, The Visual is like below.
------>Focus mode in visual will give the visual in focus mode(like a torch.)

------>If we click on the Focus mode the visual is like the below.
------->If want to go back to the visual click on Back to report.

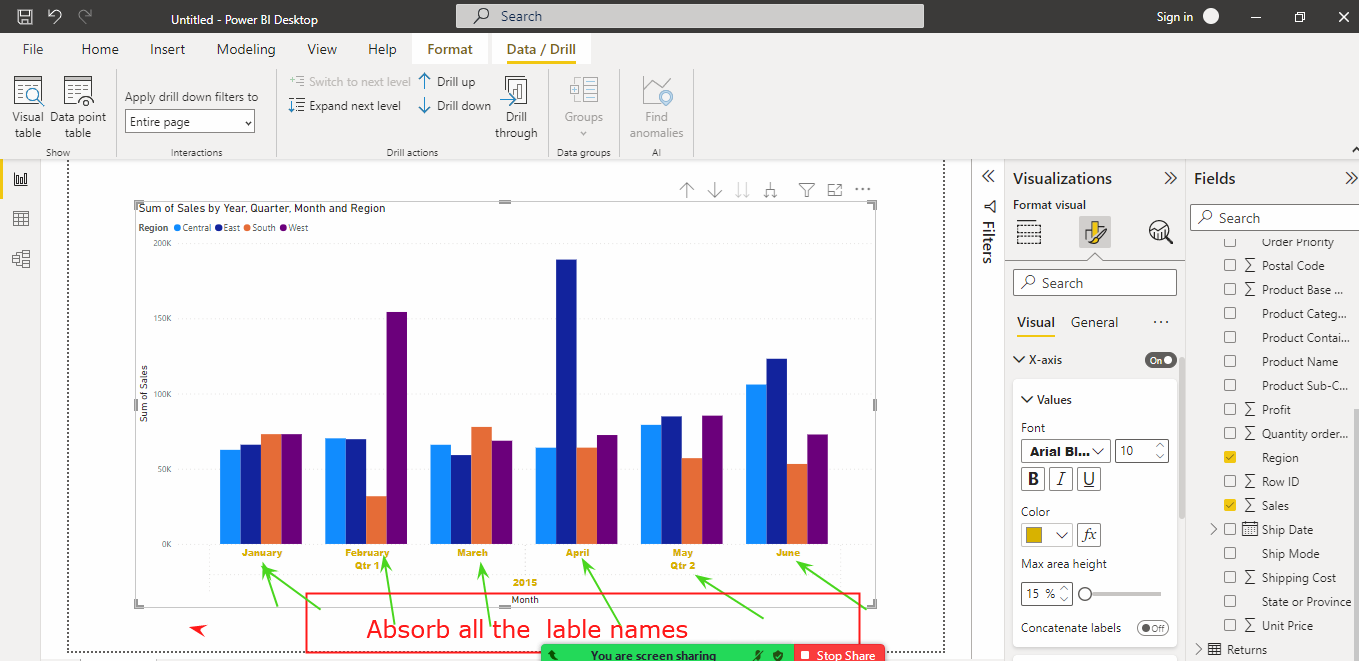
Painting For Visual
------>Click on the format visual option in the below visual.

X-Axis Visual Format
------>Under the visual format, we have two options 1)Visual and 2)General.
------>Click on Visual options.


------>Based on your requirements we can adjust the font size and colors.
------->If want to concatenate labels (along with the name Quarter ex: Quarter1 January) in X-axis we can use the option Concatenate labels is on like below.
------->Bafore Concatenation on table visual like below.
------->After Concatenation on table visual like below.

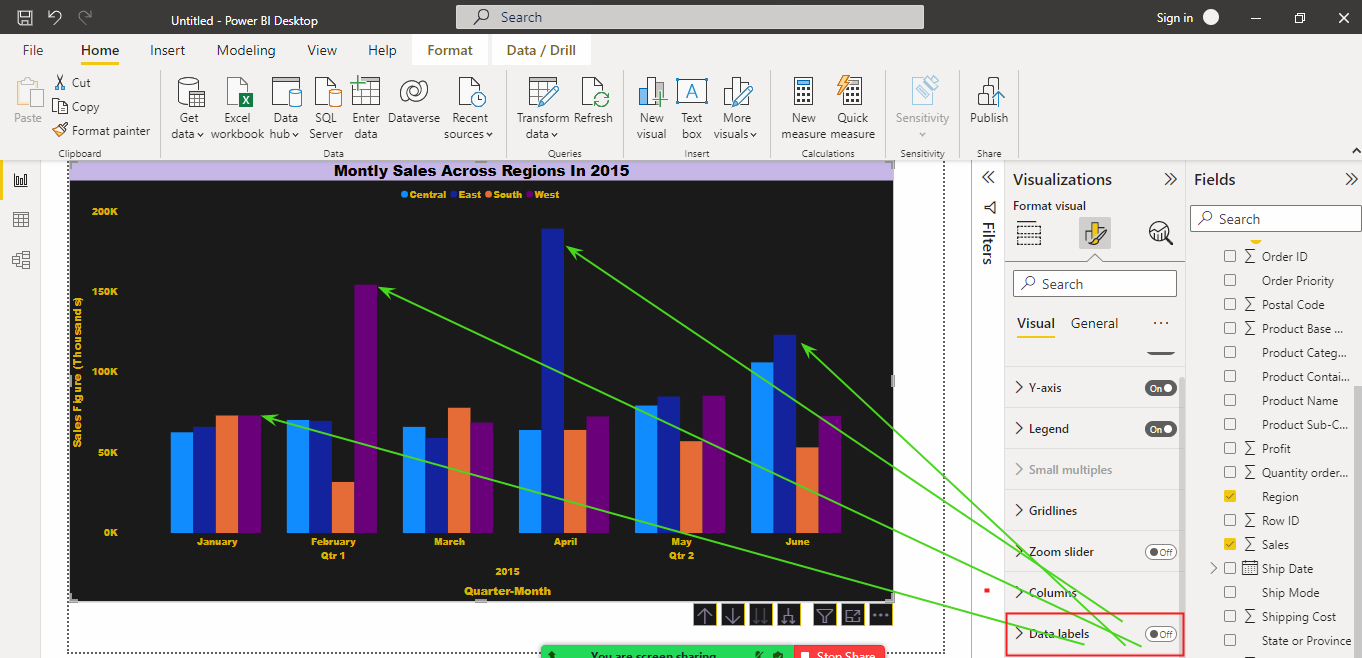
------How to Change the Title Of the X-axis----
------>If we want to change the X-Axis time we need to click on the Title text like below.

Y-Axis Visual Format
------->Like above similar we can do the same thing for the Y-axis also.
Note:-
Q)How do you want to Display units?


---->We want to display in 1000's(K), Suppose If Client will give you Millions of Data(M) then we
can choose millions also.
----->If the Client is generating revenue in Millions then we can showcase the chart in Millions(M).
----->If the Client is generating revenue in Thousands then we can Showcase the chart in thousands(K).
Q)When I can Choose the Decimal value?
------>Based on the client's Requirement we can take the Decimal values like the below.

Legend
---->Legend is mainly used to show the Visual in Category wise(like Central,North,East,South).
Note:-
-------->Legend Title is always kept in the center.
Q)When to use the TOP RIGHT STACKED?
----->When we have so many products in the legend then we can choose this option like below.

General
-------->The general option like below.

Grid Lines
------>It is a dotted line in the chart, If grid lines are there Chart not looking good, We should OFF the
gridlines for both horizontal and vertical, Whenever it is required we can turn them ON.
------>If the gridlines are ON,the Visual is like the one below.

------>If the gridlines in OFF, the Visual is like the below.

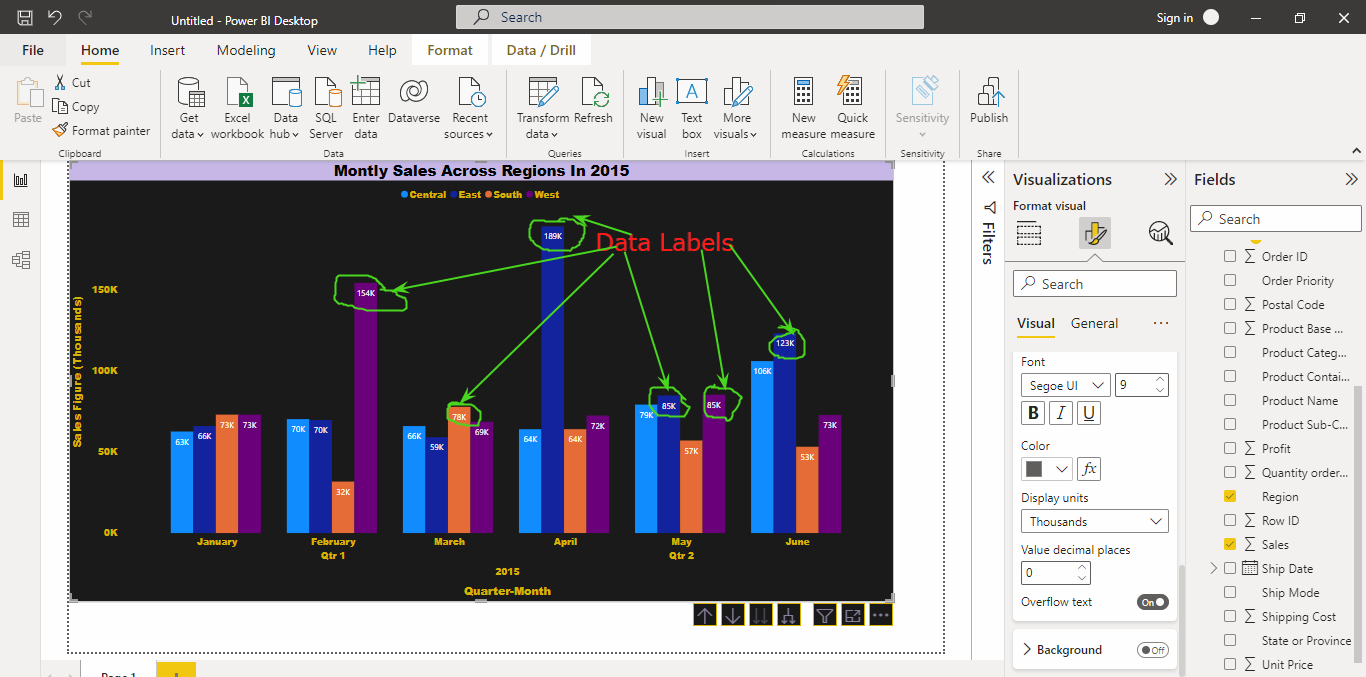
Data Label
Q)Where do we use the Data Label?
------>If we point the mouse cursor on a specific point(or)anywhere in the bar chart, Then it will show then how many total sales are done, The Visuals are like below.


------>By enabling the data label to ON, We can get all the Data labels about the sales info.

------->Befer the Data label is ON, The visuals are like below.
------>After the Data label is ON, The Visual is like the below.
Note
1)Once we ON the Date label, you always try to put the label position Inside end in the POSITION option.
2) If the Font size is bigger than the bar chart then it will not show the data label value, refer to the visual below.

------>Once we ON the Overflow text, Then text for the label values is adjusted inside the chart only, refer to the visual below.

R &D on SORT Axis Options
Note:
---->The important option we should know about sorting Axis, We can find the Sorting options like
below.

1)Sorting the Sum of the sales in descending order(means end to start) like below, it will add every total sum of the sales then it will arrange the descending order like below.
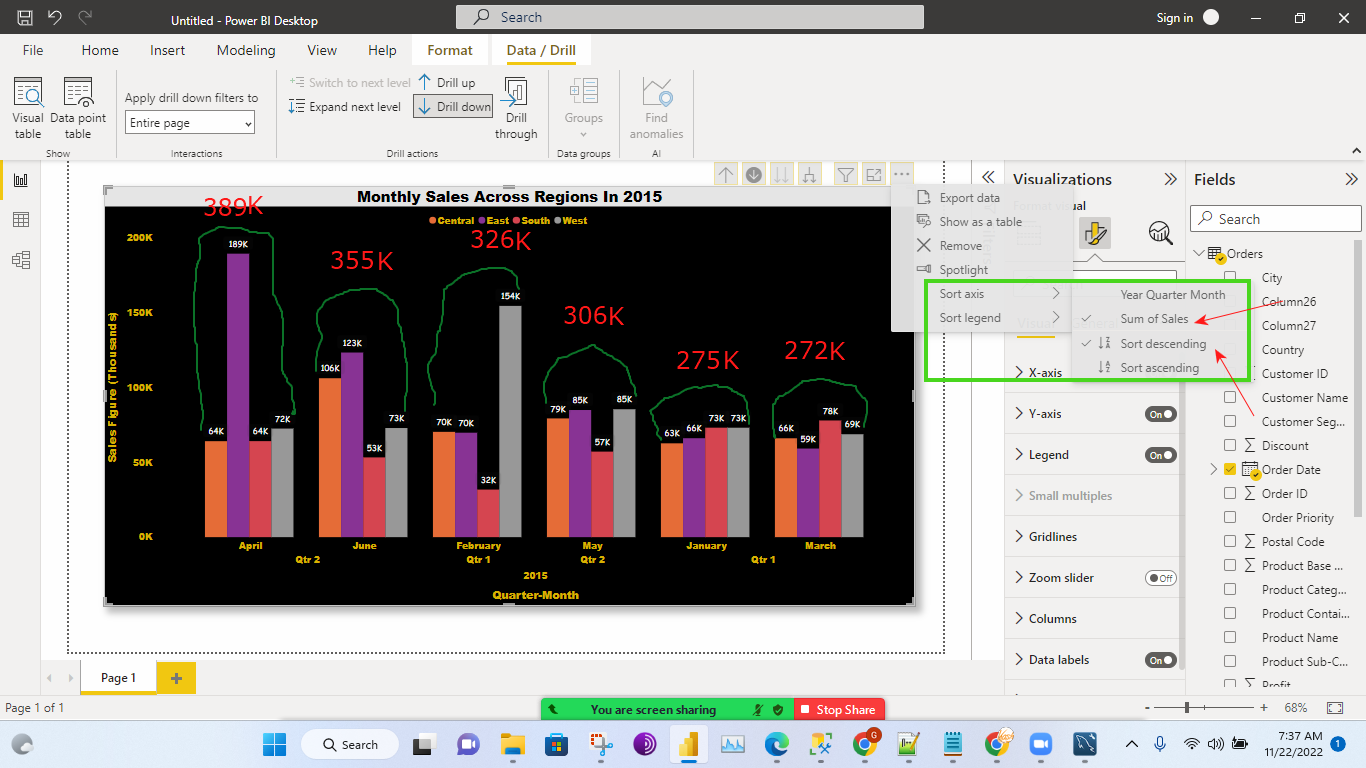
2)Sorting the Sum of the sales in Ascending order(means start to end) like below, it will add every total sum of the sales then it will arrange the Ascending order like below.

3)Sorting the Quarter-Month in Ascending order(means start to end) like below, will arrange the Quarter-Month Ascending order like below.

4)Sorting the Quarter-Month in Descending order(means start to end) like below, will arrange the Quarter-Month Descending order like below.

Important Notes
----->For example If you remove the some column we can get it back by using the show level option. ------How to do This-------
1)Visual with all the options in the order_date column like Year,Quarter,Month,Day like below.

2)If you remove Day,Month the Visual like below.

3)With the help of show all levels option we can get back,the Visual is also like below.
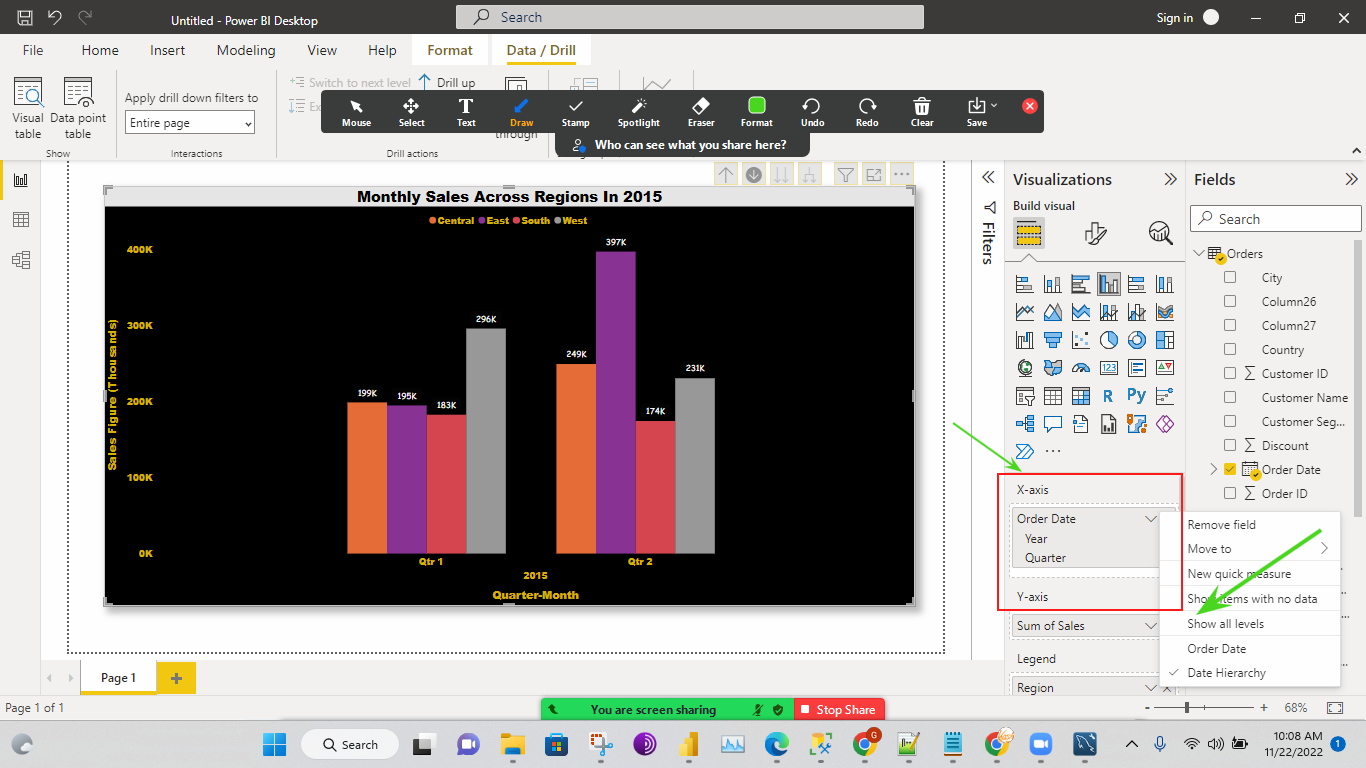
------>Then we need to click on the show all levels,Then Visual like below.

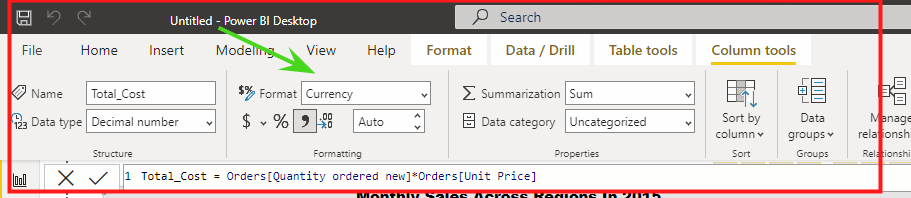
How to add the column to the table In Power BI
1)First we need to click on the more options at the right side top corner,The Visual like below.

2)Under the more options we can get so many options,the Visual like below.

3)We need to click on the New Column then the Visual like below.

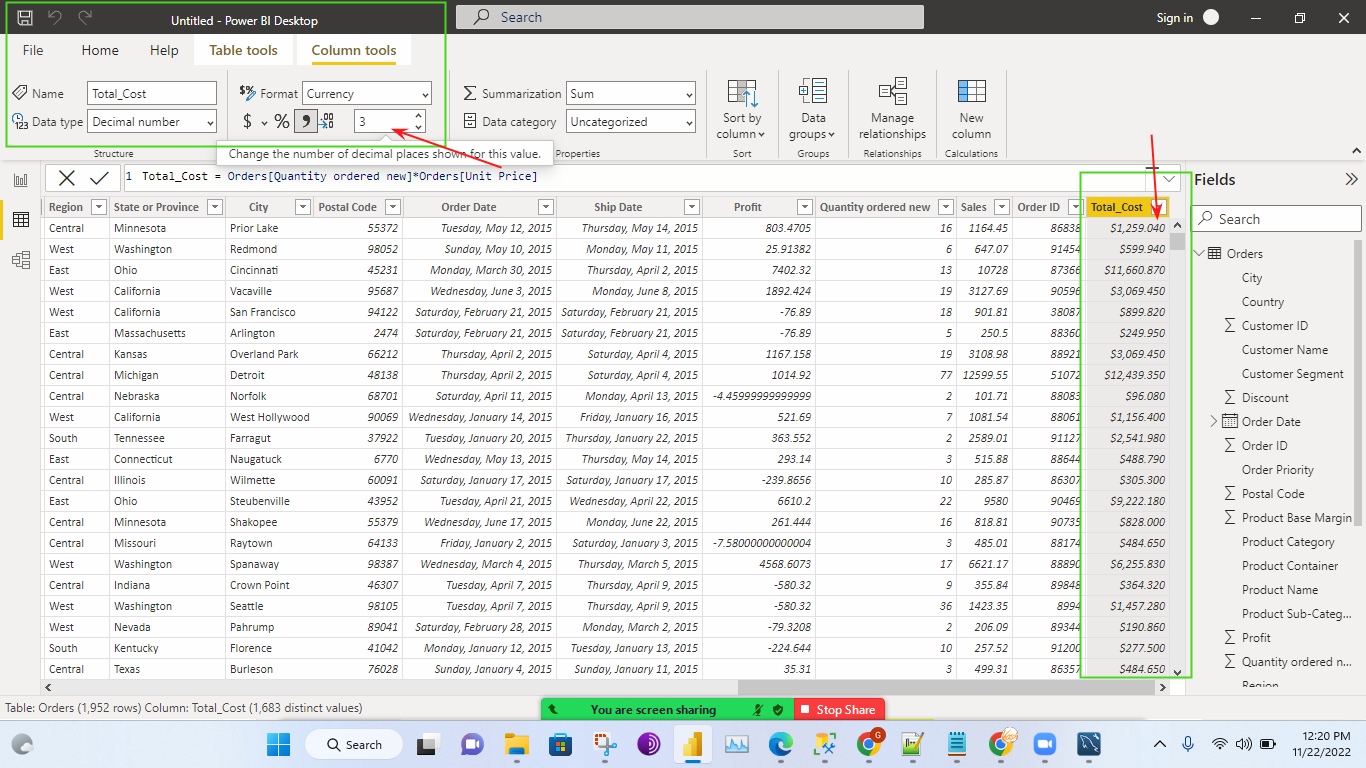
4)First we need name it for the new column(Total_Cost) here,After Once we give the table name it will also give the all the column names the Visual like below.


5)Then we can create New Column and we need to change Format also the Visual like below.
Before Format Change


After Format Change
Note:-
----->The New column(Total_Cost) is effect to the Original table also,After adding the New Column(Total_Cost),the Visual like below.

------>If you want to mention the descimal numbers,By default it will take auto for the descimal,If you want mention we can mention like below.
1)By default auto

2)If I change the descimal number some values like 0,1,2,etc.,


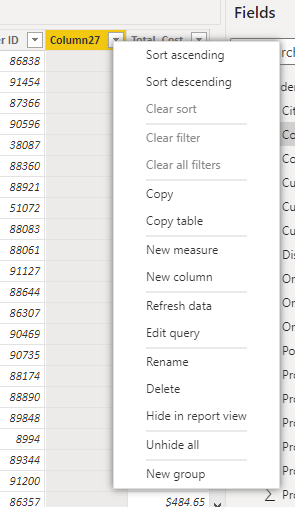
------How to Delete The Additional Columns-----
------>Right Click on the Column name then you will get options from there we can choose the delete option.
The Final Visual like below


Comments
Post a Comment